
The Dashboard
The OmniVista® Cirrus Home Page displays a dashboard with application widgets that provide a quick overview of key applications. The widgets also link directly to their application, so you can access the application for more detailed information/configuration. The Dashboard is customizable; you can add/remove widgets, and drag and drop them into any order on the Dashboard. The Global tab displays all selected widgets for all applications (Default); the WLAN Advanced tab displays all selected Wireless Application Widgets; the IoT tab displays all selected IoT Application Widgets, and the Performance Monitoring tab displays all selected Analytics Statistics Charts.
See the OmniVista Cirrus Getting Started Help for an overview of the OmniVista Cirrus User Interface, as well as procedures for setting up OmniVista Cirrus for network management.
Banner Links
The following links are available in the Banner on the Home Page and on all screens in OmniVista Cirrus:
- LAN/WLAN Menu Option - By default, all application drop-down menus (for both LAN and WLAN Devices) are displayed ("LAN+WLAN Menu"). You can click on the LAN/WLAN Menu drop-down and select "WLAN Menu" to display application drop-down menus specific to WLAN devices (e.g., SSIDs, APs). The Banner will turn gray, indicating you are in WLAN Menu Mode.
- Home - Returns the user to the Home Page.
- Admin - Displays the current user (e.g., fat2). Click to bring up the User Management Screen.
- Application Results - Displays a list of user actions taken in the Device Catalog and SSIDs applications (e.g., Remove/License/Unlicense a device, create/edit/delete SSID). Click on the Copy button to save the list of actions to the clipboard. At this time, this feature is only supported in the Device Catalog and SSIDs applications.
- Unsaved Device Notifications - If any managed devices have unsaved changes in the Working Directory, a number will appear on the Unsaved Device Notifications icon (Bell). Click on the icon to view the number of devices with unsaved changes. Click on the Save icon, then click OK at the Confirmation Prompt to save the changes to the devices. There is also an option to ignore unsaved changes for Stellar APs. Unsaved changes on Stellar APs are generally not a problem since Stellar APs receive the latest configuration at reboot. To prevent notifications for unsaved changes on Stellar APs, click on Settings, uncheck the "Unsaved Changes Notification for Stellar Access Points" checkbox, and click OK.
- Support Center - Takes you to the OmniVista Cirrus Home Page (Service Status, Help Search).
- Videos - Launches the Alcatel-Lucent Enterprise YouTube Demo Playlist.
- About - Displays basic OmniVista Cirrus information (e.g., build number and date).
- Logout - Logs you out of OmniVista Cirrus.
Note: This information is specific to the OmniVista Cirrus Dashboard. Click here for more information on working with the OmniVista Cirrus User Interface.
Applications
Applications in OmniVista Cirrus are organized as shown below. By default, all application drop-down menus (for both LAN and WLAN Devices) are displayed in the LAN+WLAN Menu. If the WLAN Menu is selected, application drop-down menus specific to WLAN devices are displayed (e.g., SSIDs, APs) to make it easier for the user to locate WLAN-specific applications. Note that there is no change to the content within the applications (i.e., the applications have not been modified to be "WLAN-specific"). The content of the applications accessed through the WLAN Menu and the LAN+WLAN Menu are the same. The menus are organized as described below.
LAN+WLAN Menu
Network
- Inventory
- Topology
- AP Registration
- Locater
- Notifications
- Analytics
- Application Visibility
- Provisioning
- IoT
Configuration
- VLANs
- CLI Scripting
- Captive Portal
- Groups
- Report
- Configuration Manager
Unified Access
- Unified Profile
- Unified Policy
- Multimedia Services
Security
- Users and User Groups
- Authentication Servers
- External Apps
Administration
- Control Panel
- Preferences
- Audit
- License
- Multi-Tenancy Service
UPAM
- Summary
- Authentication
- Guest Access
- BYOD Access
- Settings
- Web Content Filtering
WLAN
- SSIDs
- Wireless Intrusion Protection System (WIPS)
- RF Management
- Heat Map
- Floor Plan
- Client
WLAN Menu
SSIDs
- SSIDs
- WLAN Service (Expert)
APs
- Inventory
- Topology
- VLANs
- Configuration Manager
- SSH/Telnet
- Heat Map
- Floor Plan
- IoT/Location Server
- Data VPN Servers
Analytics
- Analytics Reports
- AV-Devices Management
- AV-Signature Files
- AV-Signature Profiles
- AV-Summary View
Clients
- Summary
- Client List
- Client Session
- Client Blocklist
- Locator
- Access Records
Guest/BYOD
- Guest Access
- BYOD Access
- Captive Portal
Authentication
- Policy
- NAS Clients
- Certificates
- Accounts
- Authentication Servers
- External Servers
Policies
- ACL/QoS
- Unified Profile
- Resource Groups
- Device Config
RF
- RF Home
- RF Profile
- RF Scan View
Security
- Users and User Groups
- Wireless Intrusion Protection System (WIPS)
- External Apps
- Web Content Filtering
Alarms/Logs
- Notifications
- Audit Logs
Administration
- Report
- Control Panel
- Preferences
- Licenses
- Multi-Tenancy Service
Unacknowledged Alarm Display
A real-time display of unacknowledged alarms is displayed at the bottom of the Home Page and on all screens in OmniVista Cirrus. The number of alarms in each category (e,g, Critical, Major, Minor) is displayed. Click on a category to go to the Notifications application and view all alarms in the selected category.
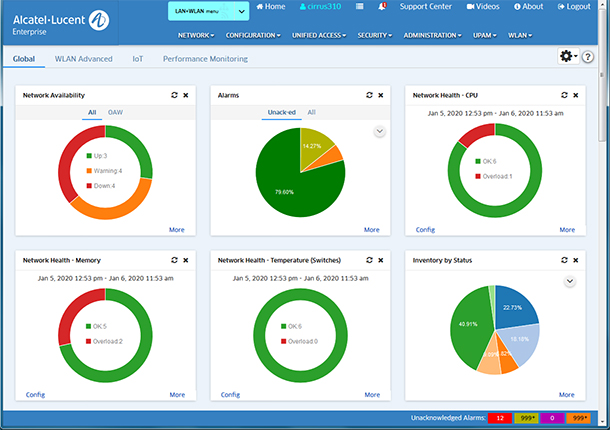
Widgets
Application widgets provide a quick overview of key applications. You can hover the mouse over a widget or click on an area of the widget to display additional information, display a legend for the information in the widget, immediately refresh widget information, remove a widget from the Dashboard, configure the widget display, and directly access an application through a widget for detailed information or application configuration. Note that the options available (e.g., display additional information, configure the widget display) vary depending on the widget.
You can also customize the Dashboard by arranging widgets on the Dashboard, adding/removing widgets to/from the Dashboard, and changing the Dashboard layout.
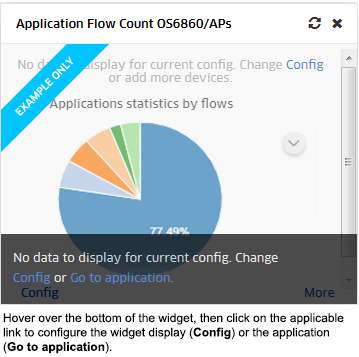
If no data has been generated for a Dashboard widget, or the widget is not properly configured to display data, a sample widget is displayed, as shown below. This may be because the application has not yet been configured (e.g., you have not created Analytics Profiles to generate Analytics Reports), or the widget may need to be configured to display data (e.g., there is no data available for the time period configured for the widget). Hover over the bottom of the widget, then click on the "Config" link to configure the widget display (if applicable), or click on the "Go to application" link to go to the application and configure the application to generate data. Note that some widgets (e.g., Inventory, Network Availability) are not configurable, so the "Config" link is not available.
Viewing Additional Information
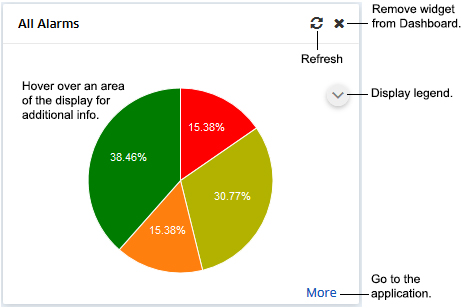
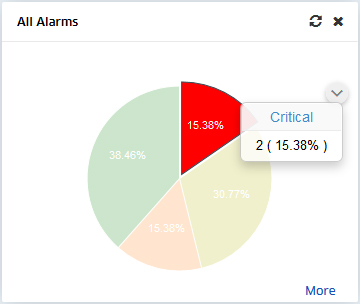
You can hover over certain widgets to display additional information, or click on an area for more detailed information. For example, the Alarms Widget displays information in a pie chart format for about Notifications for all managed devices. Hover the mouse over an area of the chart to view the number of alarms in that category and the percentage of alarms in that category. You can also click on an area of the chart to view more detailed information. The Alarms Widget will open the Notifications application to display a list of alarms in the selected category. Other widgets will display detailed information about specific devices.
Configuring the Widget Display
You can configure Dashboard display settings for certain widgets (e.g., Network Health) by clicking on the Config link at the bottom left corner of the widget. You can then modify certain display options, such as the Interval Type and Time Interval displayed in the widget. Make any modifications and click on the Save button. The widget will be displayed with the new configuration.
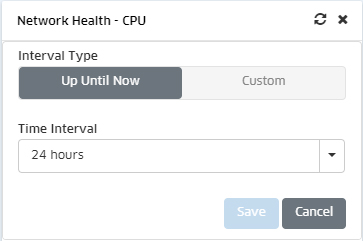
Note: This modifies the display on the Dashboard only. It does not modify the display within the application.
Linking to the Application
Click on the More link at the bottom of a widget to go to the page in the full application. For example, if you clicked on the More link in the Alarms Widget, you would go to the Notifications application. To return to the Dashboard, click on the Alcatel-Lucent Enterprise logo at the top left corner of the screen.
Customizing the Dashboard
You arrange widgets on the Dashboard by clicking on a widget and dragging it to a new location. You can also add/remove widgets to/from the Dashboard, and customize the Dashboard layout.The sections below detail the procedures for the Global Dashboard, the WLAN Dashboard, the IoT Dashboard, and the Performance Monitoring Dashboard.
Global Dashboard
The Global tab displays all selected widgets for all applications The following sections detail customizing the Dashboard for the Global Tab.
Adding Widgets
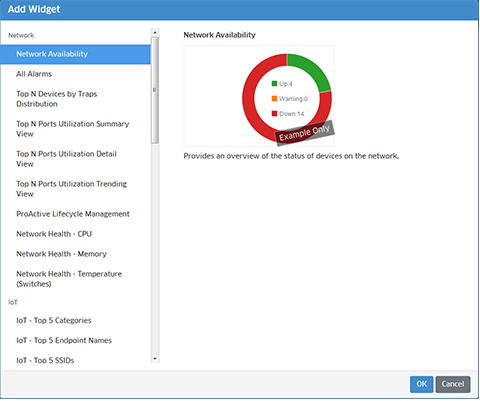
To add a widget to the Global Dashboard, click on the Settings icon and select Add Widget. The Add Widget Screen, shown below is displayed. Available widgets are displayed on the left side of the screen. (Widgets already on the Dashboard are not displayed.) You can select a widget to display a sample of the widget and a brief summary of the information provided by the widget.
Select an available widget from the list and click OK. The widget will be added to the upper-left of the Dashboard. You can then drag and drop the widget to any position in the Dashboard. Note that you can only add one widget at a time. Repeat the procedure to add additional widgets.
Removing Widgets
To remove a widget from the dashboard, click on the Delete icon at the top-right corner of the widget. You can add the widget back or add a new widget by clicking on the Settings icon and selecting Add Widget.
Changing the Dashboard Layout
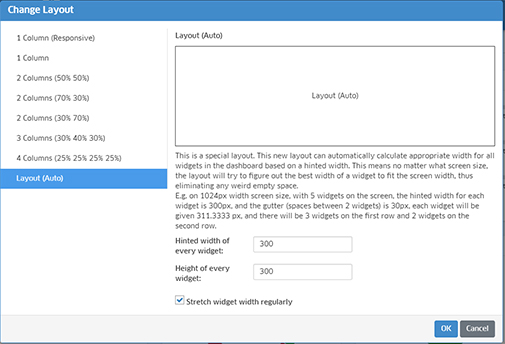
The Settings option also enables you to customize the Dashboard layout. To customize the layout, click on Settings icon and select Change Layout. The Change Layout Screen appears. By default, widgets are displayed in the "Auto" layout. To change the layout, select an option on the left. When you select a layout on the left, the layout is displayed in the Layout area. To choose that layout, click OK. The change takes effect immediately. If necessary, you can re-arrange the widgets in the new layout by clicking and dragging them to new locations on the Dashboard.
WLAN Advanced Dashboard
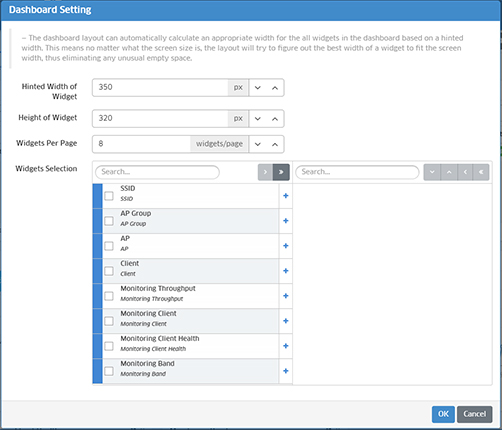
The WLAN Advanced tab displays all selected Wireless Application Widgets. Click on the Settings icon to bring up the Dashboard Setting Window (shown below). Select layout options, then select the application widgets you want to display on the Dashboard. (Available widgets are displayed in the left column; selected widgets are displayed in the right column.) Click OK to apply the settings. If necessary, you can re-arrange the widgets in the new layout by clicking and dragging them to new locations on the WLAN Dashboard.
Note: By default, information for all managed APs is displayed in the widgets on the WLAN Dashboard. However, you can filter the information displayed by clicking on the View By link in the top left corner of the Dashboard and filtering the information displayed by SSID, AP Group, AP, and Client. The display filter will persist until it is changed or you log out of the session. If you log out, the display will return to the default setting (All).
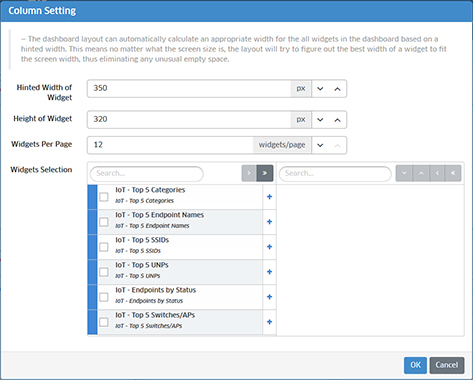
IoT Dashboard
The IoT tab displays all selected IoT Application Widgets. Click on the Settings icon to bring up the Column Setting Window (shown below). Select layout options, then select the application widgets you want to display on the Dashboard. (Available widgets are displayed in the left column; selected widgets are displayed in the right column.) Click OK to apply the settings. If necessary, you can re-arrange the widgets in the new layout by clicking and dragging them to new locations on the IoT Dashboard.
Performance Monitoring Dashboard
The Performance Dashboard displays Analytics Statistics Chart View Profile widgets. Statistics Chart View Profiles are graphical displays of collected statistics data. The profiles are configured in the Analytics application on the Analytics Statistics Chart View Screen (Network - Analytics - Statistics - Chart Views). To add a Statistics Chart View Profile widget to the dashboard, click on the Add icon at the top-right corner of the screen to bring up the Add Statistics Widget Window. Enter a Name for the widget, select a Statistics Chart View Profile from the Chart View Profile drop-down, and click on the Create button. The Statistics Chart View Profile will appear as a widget on the Performance Monitoring Dashboard. Repeat to add additional profile widgets. You can add up to 20 widgets to the dashboard. Note that you can click on the "Add New" link in the Chart View Profile drop-down to go to the Create View Profile Screen and create additional profiles, then return to the Dashboard to create a new widget. Also note that if you delete a profile from the Analytics Chart Views Screen, the widget for that profile will be removed from the Performance Monitoring Dashboard.
By default, a graphical view of the profile is displayed. Click on the Table icon at the top of the widget to display the data in table format. Click on the Graph icon at the top of the widget to return to graphical view. You can also click on the "Config" link at the bottom of the widget to modify the display time range.
Application Widgets
The following Global, WLAN Advanced, and IoT application widgets are available. Some widgets (e.g., Network Availability, Licenses) collect and display information automatically. Others (e.g., Alarms, Top N Clients) require configuration in an application (e.g., Notifications, Application Visibility/Analytics) to display information. The descriptions below provide an overview of the information provided by each widget and a link to the applicable help file for application configuration, if required. For detailed configuration procedures, see the applicable online help.
Global Application Widgets
The following Global application widgets are available.
Network
- Network Availability - Displays the current operational state (Up/Warning/Down) of all managed LAN Devices (All), and for APs (OAW). Each warning state is displayed as a percentage of all monitored switches. Click on a warning state to view a list of devices in that state. You can then click on a link to the Notifications application to view traps.
- Alarms - Displays an overview of Notification alarms (Acknowledged and Unacknowledged) for all managed devices by severity level (Normal, Warning, Minor, Major, Critical). Click on "Unack-ed" to view Unacknowledged Alarm information. Click on "All" to view information on all alarms (Acknowledged and Unacknowledged). Click on a severity level in the pie chart to go to the Notifications Home Screen and view traps with the selected severity level. You must configure traps in the Notifications application to generate and display information for this widget.
- Top N Devices by Trap Distribution - Displays a summary of traps by device and severity level. You must configure traps in the Notifications application to generate and display information for this widget.
- Top N Ports Utilization Summary View - Displays a summary view of the top network ports based on utilization. Switches/ports are displayed in a list view from highest to lowest utilization for the configured time period (e.g., day, week). You must create an Analytics Profile in the Analytics application and assign the profile to switches/ports to generate and display information for this widget.
- Top N Ports Utilization Detail View - Displays a detailed bar chart view of the top network ports based on utilization. While the Summary View displays the information for the configured time period (e.g., last 24 hours), this view provides a detailed view of the specified time interval. For example, if a report is configured to display information for the last 24 hours, the Detail View displays information for each hour within those 24 hours. Hover over an area in a bar chart to view information about devices/ports. You must create an Analytics Profile in the Analytics application and assign the profile to switches/ports to generate and display information for this widget.
- Top N Ports Utilization Trending View - Displays predicted future port utilization in a line chart based on past utilization. Port utilization predictions can provide valuable insight for capacity management. Click on a data point to view information about devices/ports. You must create an Analytics Profile in the Analytics application and assign the profile to switches/ports to generate and display information for this widget.
- Network Health - CPU - Displays CPU usage information for all discovered devices. You can also set CPU Health Thresholds. These thresholds will be used to generate Notifications Traps in the Notifications applications if CPU Health Traps are configured.
- Network Health - Memory - Displays Memory usage information for all discovered devices. You can also set Memory Health Thresholds. These thresholds will be used to generate Notifications Traps in the Notifications applications if Memory Health Traps are configured.
- Network Health - Temperature - Displays Temperature information for all discovered devices. You can also set Temperature Health Thresholds. These thresholds will be used to generate Notifications Traps in the Notifications applications if Temperature Health Traps are configured.
- Inventory by Status - Displays a summary view of all devices in the Device Catalog by device status (e.g., OV Managed, Waiting for First Contact). Click on the "More" link to go to the Device Catalog application.
- Inventory by SW Version - Displays a summary view of all devices in the Device Catalog by software version (e.g., 8.4.1.141.R03). Click on the "More" link to go to the Device Catalog application.
- OmniVista Network Advisor - Displays a list of OmniVista Network Advisor instances that are available to assign to one or more devices. Click on Launch to open the website for the Network Advisor instance. Click on the "More" link to open a list of Network Advisor instances from which you can add or remove instances.
IoT
- IoT - Top 5 Categories - Displays a list of the top 5 IoT categories based on the number of endpoints in each category. Click on each tab to view by endpoint status (Active/Error/Offline). Click on the "More" link for a table view of all endpoints by category.
- IoT - Top 5 Endpoint Names - Displays a list of the top 5 IoT endpoint names based on the number of endpoints by name. Click on each tab to view by endpoint status (Active/Error/Offline). Click on the "More" link for a table view of all endpoints by name.
- IoT Top 5 SSIDs - Displays a list of the top SSID endpoint names based on the number of endpoints on each SSID. Click on each tab to view by endpoint status (Active/Error/Offline). Click on the "More" link for a table view of all endpoint SSIDs.
- IoT - Top 5 Switches/APs - Displays a list of the top switches/APs based on the number of endpoints connected to the switch/AP. Click on each tab to view by endpoint status (Active/Error/Offline). Click on the "More" link for a table view of all switches/APs.
- IoT Top 5 UNPs - Displays a list of the top UNPs based on the number of endpoints assigned to each UNP. Click on each tab to view by endpoint status (Active/Error/Offline). Click on the "More" link for a table view of all UNPs.
- IoT - Endpoints by Status - Displays an overview of all endpoints by status (Error/Active/Offline). Hover over a status to view the number and percentage of endpoints in each status. Click on the "More" link for a detailed table view of all endpoints.
WLAN
- UPAM Status - Displays the administrative status of the AP Service in OmniVista Cirrus.
- AP Groups - Displays information for all configured AP Groups. Click on a group to display information on APs in the group.
- AP Management - Displays information for all Managed and Unmanaged APs. Click on a category (Managed, Unmanaged) to display an overview of the administrative status for APs in that category (the number of APs Up/Down). Click again on that status information for information on the individual APs in that category.
- Intrusive AP - Displays the number of Intrusive APs detected on the network by category (e.g., Rouge AP, Interfering AP). Click on a category to display information for information on the individual APs in that category. This widget displays information based on policies configured in the WIPS application.
- Wireless Attacks in the Last 24 Hours - Displays information about attacks on the wireless network. This widget displays information based on policies configured in the WIPS application.
- Client Health - Displays information about all clients currently connected to APs, including Blocklisted Clients. The graph gives an overview of signal strength for clients, including the number of clients in each category.
- Best - Signal strength is more than -65
- Good - Signal strength is between -80 and -65
- Fair - Signal strength is less than -80.
Application Analytics - Layer 7
- Application Flow Count OS6860/APs - Displays traffic flow information for applications/application groups discovered on the network, and the percentage of network resources being used by each application for the selected devices and configured time period. OS6860/OS6860E Switches and APs provide flow information (number of flows) in the App Discovery view and packet/byte information in the App Count view.
- Application Count Summary View - Displays packet/byte count information for applications/application groups discovered on the network, and the percentage of network resources being used by each application for the selected devices and configured time period. The information is displayed in pie chart view.
- Application Count UNPs Summary View - Displays packet/byte count information for applications/application groups discovered on the network over the configured period of time, and the percentage of network resources being used by each application by UNP. The information is displayed in pie chart view.
- Application Count Detail View - Displays packet/byte count information for applications/application groups discovered on the network, and the percentage of network resources being used by each application for the selected devices and configured time period. The information is displayed in line chart view.
- Application Count UNPs Detail View - Displays packet/byte count information for applications/application groups discovered on the network over the configured period of time, and the percentage of network resources being used by each application by UNP. The information is displayed in line chart view.
General
- Locator - Used to locate the switch and slot/port that is directly connected to a user-specified end station. Enter the end station's IP Address, Host Name, MAC address, or Authenticated User ID to locate the switch and slot/port to which the end station is connected. Enter the search criteria and click on Locate. OmniVista will display the results in the Locator application.
- Favorites - The Favorites widget allows users to create a list of “quick links” for easy access to any OmniVista Cirrus application. To add an application to the Favorites list, start typing the name of the application in the text box. As text is entered, auto-complete displays a list of matching applications. Click an application to select it, then click the add icon. To replace an application in the list of Favorites, click the
- Device Licenses - Displays an overview of device license usage. Information is displayed for all license types (Essential, Core, Stellar AP), including the number of devices being managed, maximum number of devices that can be managed, and expiration (if applicable).
- Service Licenses - Displays an overview of service license usage. Information is displayed for all enabled licenses (Guest Devices and BYOD Devices) including the number of devices being managed, maximum number of devices that can be managed, and expiration (if applicable).
- Location Based Services - Provides a link to the OmniAccess® Stellar Location Based Services (LBS) Cloud Manager application. The OmniAccess Stellar LBS solution provides comprehensive indoor location services including way-finding, location-based push notifications and location analytics.
- Network Health Unacknowledged Traps - Displays the number of unacknowledged Switch Module, Switch Port, AP CPU, and AP Memory Traps. Click on a row to go to the Notifications applications to view the traps. If necessary, click on the "Config" link at the bottom of the widget to go to the Notifications application and quickly configure the necessary traps. After selecting devices on the Devices Selection Screen of the Trap Configuration Wizard, the applicable traps (healthMonModuleTrap, healthMonPortTrap, apCPUOverrun, apMemoryOverrun) will be pre-selected on the Configure Traps Screen.
WLAN Advanced Widgets
The following WLAN advanced application widgets are available.
- SSIDs - Displays all configured WLAN Services.
- AP Groups - Displays information for all configured AP Groups. Click on the "AP(s)" link in the AP Count column to display information on APs in the group. This widget automatically displays information for all configured groups.
- APs - Displays information for all registered APs. This widget automatically displays information for all registered APs
- Most Recent 1000 Client Records - Displays information about all active clients on the network. Click on the "More" link at the bottom of the widget to display the most recent 1,000 client sessions on all Stellar APs on the network. You can then click on the "Go to App" link to go to the UPAM Wireless Client List Screen. Click on a client in the widget to bring up the "Details of Client" window, which displays detailed information about the selected client and its sessions.
- Client Health - Displays health information for all clients currently connected to APs. This widget automatically displays information for all registered APs.
- Band Usage - Displays radio band information for all clients currently connected to APs. This widget automatically displays information for all registered APs.
- Client Density - Displays information about the number of clients and system throughput on your network.
- Upload Throughput - Displays information about client upload throughput.
- Download Throughput - Displays information about client upload throughput.
- Distribution of Clients per AP- Displays information about the number of clients associated with each AP.
IoT Widgets
The following IoT application widgets are available.
- IoT - Top 5 Categories - Displays a list of the top 5 IoT categories based on the number of endpoints in each category. Click on each tab to view by endpoint status (Active/Error/Offline). Click on the "More" link for a table view of all endpoints by category.
- IoT - Top 5 Endpoint Names - Displays a list of the top 5 IoT endpoint names based on the number of endpoints by name. Click on each tab to view by endpoint status (Active/Error/Offline). Click on the "More" link for a table view of all endpoints by name.
- IoT Top 5 SSIDs - Displays a list of the top SSID endpoint names based on the number of endpoints on each SSID. Click on each tab to view by endpoint status (Active/Error/Offline). Click on the "More" link for a table view of all endpoint SSIDs.
- IoT - Top 5 Switches/APs - Displays a list of the top switches/APs based on the number of endpoints connected to the switch/AP. Click on each tab to view by endpoint status (Active/Error/Offline). Click on the "More" link for a table view of all switches/APs.
- IoT Top 5 UNPs - Displays a list of the top UNPs based on the number of endpoints assigned to each UNP. Click on each tab to view by endpoint status (Active/Error/Offline). Click on the "More" link for a table view of all UNPs.
- IoT - Endpoints by Status - Displays an overview of all endpoints by status (Error/Active/Offline). Hover over a status to view the number and percentage of endpoints in each status. Click on the "More" link for a detailed table view of all endpoints.